Here’s a question that’s both easy and difficult to answer: What is sleep? Nearly everyone knows the basic definition: Sleep is when we close our eyes, slip from consciousness, and rest for anywhere from a few minutes to many hours at a time. But when it comes to scientifically defining sleep—the physiological, cognitive, and evolutionary components—we have a long way to go.
In the United States alone, sleep disorders affect up to 70 million people. They cost $16 billion per year in medical expenses and another $50 billion in lost productivity. Many sleep disorders are difficult to diagnose, too, requiring overnight stays in sleep labs and being watched over by video cameras and various sensors.
One solution is to understand the genetic bases for sleep and sleep disorders. Rather than having people spend a few nights in a sleep lab, some experts envision sequencing a person’s genome and looking for mutations that might indicate the presence of certain sleep disorders. Genome sequencing is not commonplace today, but it probably will be in the future—the cost of sequencing an entire genome has fallen by an order of magnitude every 2 years since 2007. But before we can identify sleep disorders at the genetic level, scientists must first understand which genes are involved in sleep and related disorders.
“In theory, it should be pretty simple,” says Blake McShane, a statistician and professor of marketing who has collaborated with medical researchers and doctors on a handful of sleep studies. “You just sequence peoples’ genes and then watch their sleep behaviors, right?” Not so fast, he says. That first requires the aforementioned sleep labs and associated sensors and machinery, all of which are expensive. And there are other issues. “The set of people you get who are willing to sign up for a 2-week study like that are not necessarily a representative sample of the population at large,” he adds. “So what do scientists do? They use mice.”
Studying Sleep
Mice are a classic model organism used throughout medicine and the life sciences to understand various aspects of human physiology. Mice are simpler organisms than human beings, cheaper and easier to work with, and come with fewer ethical concerns. But that does not mean it is easy. “It turns out studying sleep in mice is fraught with a lot of difficulty,” McShane says. “It’s slow, it’s invasive, it’s very time consuming.”
Traditional mouse sleep studies involve lots of manual labor. Technicians must surgically implant electrodes into the mice’s heads. After the mice have recovered, their brain activity is recorded by electroencephalography (EEG) and electromyography (EMG), which then have to be interpreted by experts. The EEG and EMG readings are broken up into 4- or 10-second epochs, meaning 24 hours of data contains up to 21,600 epochs, all of which need to be manually scored. On top of that, experts often differ in their scoring by 5 to 10 percent. Automating any part of this process would be a boon for sleep scientists. That’s where McShane’s expertise as a statistician came in.
Alan Pack, a professor at the University of Pennsylvania and director of the sleep center there, recruited McShane and others from the Wharton Statistics Department, where he completed his doctorate, to see if anything could be done to simplify the process. The first task was to try to understand sleep in detail.
McShane, Pack, and their colleagues started by analyzing the sleep patterns of four inbred mice strains—each with different known sleep behaviors—the old-fashioned way, with electrodes and EEGs. Once they had recorded 24 hours of data for each subject, they split it into 4- and 10-second epochs, which were then scored by experts into three sleep stages—wake, rapid eye movement (REM) sleep, and non-REM sleep. Those scores served as the standard against which later statistical techniques would be measured.
Decomposing the Data
The sort of data that results from mouse sleep studies is unusual, though in the medical world it is not uncommon. If you look at a distribution of the data on each sleep stage, it tends to have a large spike to the left near zero and a long tail to the right. McShane and his colleagues call it a “spike-and-slab” distribution (Figure 1). Compared with humans, mice frequently flit between states of wakefulness, non-REM sleep, and REM sleep. Many episodes last for only a minute, but occasionally they last for 30 minutes or more. (Mouse sleep patterns are very different from those of humans—the longest a mouse stayed awake in these studies was 3 hours.) In humans, survivorship distributions for various diseases follow a similar distribution, with most people unfortunately succumbing to the disease in the first few months and a few surviving for many, many years.
Figure 1. An example of a spike-and-slab distribution. On the upper panel, we see an unwieldy distribution composed of a large mass near one and a long, flat tail extending out to about ten. On the bottom panel, this distribution is decomposed into a “spike” component and a “slab” component.
The spike-and-slap distribution makes common statistical measures—such as average and the ANOVA F-test—ill-suited for describing the data. “With data like that, you need to be much more careful in your modeling strategy,” McShane says. The wrong statistical measures can mask important information. Take, for example, that mouse that stayed awake for 3 hours. Such sleeplessness could be symptomatic of a sleep disorder, but with common statistical measures researchers would have a difficult time distinguishing that mouse from others without a disorder.
By decomposing the distributions into the two dominant components—the spike and the slab, analyzing each separately, and using queues from the classification of surrounding epochs, McShane and his colleagues had no difficulty discerning wake, REM, and non-REM patterns in their subjects. More importantly, they could also easily tell when the mice transitioned from one state to another. That understanding would be invaluable in their next study.
Automating Sleep Studies
McShane and his colleagues next endeavored to eliminate the need for manual scoring of EEG and EMG data. They wanted to automate the process. To do that, McShane and his previous co-authors, along with Michael Biber, used video recordings of mice. Other researchers have used video in sleep studies, but the level of sophistication was low—only wake and sleep could be discerned, not the separate stages of REM sleep and non-REM sleep.
McShane and his colleagues used the model they had built for the previous study as a starting point. Again, they implanted mice with electrodes and recorded EEG data. But this time they also recorded video of the mice as they slept and scurried over 24 hours. The EEG and EMG data told them when the mice were awake, in REM sleep, or in non-REM sleep. Paired with the video, they could look for clues in the video that would correspond with those stages.
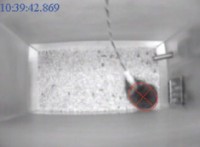
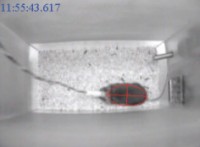
Some of the clues were easy. A mouse scurrying across the screen is definitely awake. But movement alone isn’t enough. Mice, like humans, do not remain entirely still when sleeping. They breathe and twitch, motions that are easy for humans to filter out but difficult for computers. So McShane and his colleagues looked for other clues. One was velocity. By breaking down the video frames into pixels, they filtered out small motions like breathing and twitching. They also noticed that mice tend to relax when slipping into REM sleep—they literally looked fatter as their muscles lost tension (Figure 2). This, too, could be quantified on the video screen. Armed with these clues, McShane and his colleagues created a model that was trained by EEG and EMG data to determine what patterns in the video corresponded with certain sleep stages.


Figure 2. A mouse in REM sleep (left) and awake (right). Notice the tell-tale fatter shape of the mouse in REM sleep, a sign of muscle atonia.
The first attempt at scoring the video was not bad, but it was not great. If the researchers ignored the EEG and EMG, they could easily tell when the mice were awake. Determining REM versus non-REM was more difficult. So McShane and his colleagues iterated their model, coming up with a more intelligent solution. From theirs and others’ previous studies, they knew that some sleep states cannot be reached from others. For example, people do not fall immediately into REM sleep from wakefulness—there is always an intervening bout of non-REM sleep. Furthermore, people woken from REM sleep often fall back asleep. Waking from non-REM sleep is more successful. The same is true in mice.
Their intelligent model performed well, guessing wrong only 8.8 percent of the time compared with 4.8 percent for the human scorers.
Their revised model took this information into account. It intelligently analyzed an epoch by looking at what stage—wake, REM, or non-REM—the mouse was in in neighboring epochs. For example, if the base model scored a long stretch of epochs as REM but scored a single epoch in the middle of the stretch as WAKE, the more intelligent model would reconsider that single epoch before assigning a final score. This is because—unless you suffer from narcolepsy—it is biologically impossible to transition directly from REM sleep to wakefulness. Thus, the model would change that errant single WAKE to REM.
Their intelligent model performed well, guessing wrong only 8.8 percent of the time compared with 4.8 percent for the human scorers. It was well within the historical average for manual scorers, too, of 5 to 10 percent, meaning sleep researchers can now use relatively low-cost video instead of relying on high-cost electrode implantation and manual scoring.
Informing Our Genetic Understanding
The accuracy of the model bodes well for scientists performing genetic studies, who often have to sort through dozens to hundreds of mice to determine which have a certain sleep disorder. Indeed, McShane and his colleagues have already put their techniques to use studying a strain of mouse that has a particular gene knocked out, Homer. The absence of that gene makes the mice unable to stay awake for long periods of time.
Eventually, the model may even move out of the laboratory. “The long, long, long-term goal is to do this with humans,” McShane says. “Instead of having to go to a lab where you get all these things implanted on you, you go into the doctor, get a tripod, stick it in front of your bed, and hit record.” The doctor will then run the video through software based on McShane and his colleagues’ model to determine the nature of the individual’s sleep disorder.
These advances also showcase the power of statistics in disrupting existing laboratory techniques and pushing scientific understanding forward. Many other fields have benefitted similarly, but McShane prefers to liken them to his favorite sport, baseball. “The old metrics are sort of like batting average, and the new metrics are sort of like on-base percentage. They’re more revelatory. They tell you a deeper story.”
Related reading on Kellogg Insight
The Biochemistry of Financial Risk: Testosterone’s influence on financial decisions
The Financial Hazards of Aging: Why older adults choose riskier investments
McShane, Blakeley B., Raymond J. Galante, Shane T. Jensen, Nirinjini Naidoo, Allan I. Pack, and Abraham Wyner. 2010. “Characterization of the Bout Durations of Sleep and Wakefulness.” Journal of Neuroscience Methods. 193(2): 321-333.
McShane, Blakeley B., Raymond J. Galante, Michael Biber, Shane T. Jensen, Abraham J. Wyner, and Allan I. Pack. 2012. “Assessing REM Sleep in Mice Using Video Data.” Sleep. 35(3):433-442.
Naidoo, Nirinjini, Megan Ferber, Raymond J. Galante, Blake McShane, Jia Hua Hu, John Zimmerman, Greg Maislin, Jacqui Cater, Abraham Wyner, Paul Worley, and Allan I. Pack. 2012. “Role of Homer Proteins in the Maintenance of Sleep-Wake States.” PLoS ONE. 7(4): e35174.


