Featured Faculty
Nathan S. and Mary P. Sharp Professor of Finance
Harold H. Hines Jr. Professor of Risk Management
Lisa Röper
Since 1993, the Cboe Volatility Index (VIX) has offered investors a real-time measure of stock market volatility: namely, how much the market expects prices on the S&P 500 to change over the next 30 days.
This information is used by investors, economists, and others in several different ways. For one, VIX is commonly interpreted as a gauge of investor sentiment, with a higher VIX signaling that investors anticipate higher levels of turbulence or risk. For this reason, the VIX is also commonly called the “fear index.”
VIX is also used as the underlying asset in a variety of volatility derivatives. For instance, investors might buy VIX futures contracts (where they can lock in the price of VIX in the future), either to speculate on short-term fluctuations in volatility or as a kind of insurance for their portfolios.
“People think if we get a bad economic shock, volatility goes up,” says Torben Andersen, a professor of finance at Kellogg. “So, people often buy volatility derivatives as a hedge against bad outcomes.”
All these use cases have made the VIX arguably the most popular indicator of stock market volatility in the U.S. “The VIX is the volatility index,” explains Viktor Todorov, also a Kellogg professor of finance. “When things really go bad, people start mentioning, ‘Oh, the VIX is at a very, very high level.’”
But despite VIX’s popularity, Todorov and Andersen believe it is hardly the pure measure of volatility or fear that many investors believe. Specifically, they argue that VIX combines into a single measure both investors’ expectations about the S&P 500’s day-to-day volatility and their fears of a rare but catastrophic (or “tail”) event that tanks equity prices.
This muddles VIX’s overall usefulness, the researchers say. If expected volatility and tail concerns were separated, investors could better measure the component they were most interested in.
Here’s the good news: now investors can.
To address these shortcomings with VIX, Todorov and Andersen have built two new indices, backed by their own published research, that are now listed on Cboe alongside VIX.
The first of these is the Cboe S&P 500 Spot Volatility Index, called SPOTVOL. As the name implies, this index focuses on more immediate fluctuations in the market. Or as Andersen puts it, SPOTVOL “measures the current volatility rather than mixing it with the tail events.”
Despite VIX’s popularity, Todorov and Andersen believe it is hardly the pure measure of volatility or fear that many investors believe.
This makes it useful for investors who want to optimize their market entry and exit points, says Todorov. “There’s a lot of strategies … in which you time your participation in the market according to the level of volatility. Having a better measure of volatility should help you more precisely implement volatility-timing strategies.”
SPOTVOL could also be used by investors wishing to protect their portfolio from day-to-day market fluctuations—helping them decide when to hedge against short-term price swings, for example.
The second index is the Cboe S&P 500 Left Tail Volatility Index, called LTV. This index, in turn, tracks investors concerns about those rare-but-dreaded extreme tail events, sometimes described as “black swans.” This worry often (though not always) lingers for longer periods of time, making LTV particularly useful for traders who might wish to take positions on the market four-to-eight months out.
Investors can also use LTV to help them decide when to hedge against extreme tail events, perhaps by moving to assets that are safer or would otherwise profit from sharp declines in the market.
In addition to SPOTVOL and the LTV being used individually, they can also be used alongside the VIX to provide a more robust picture of market conditions than any single index could provide on its own.
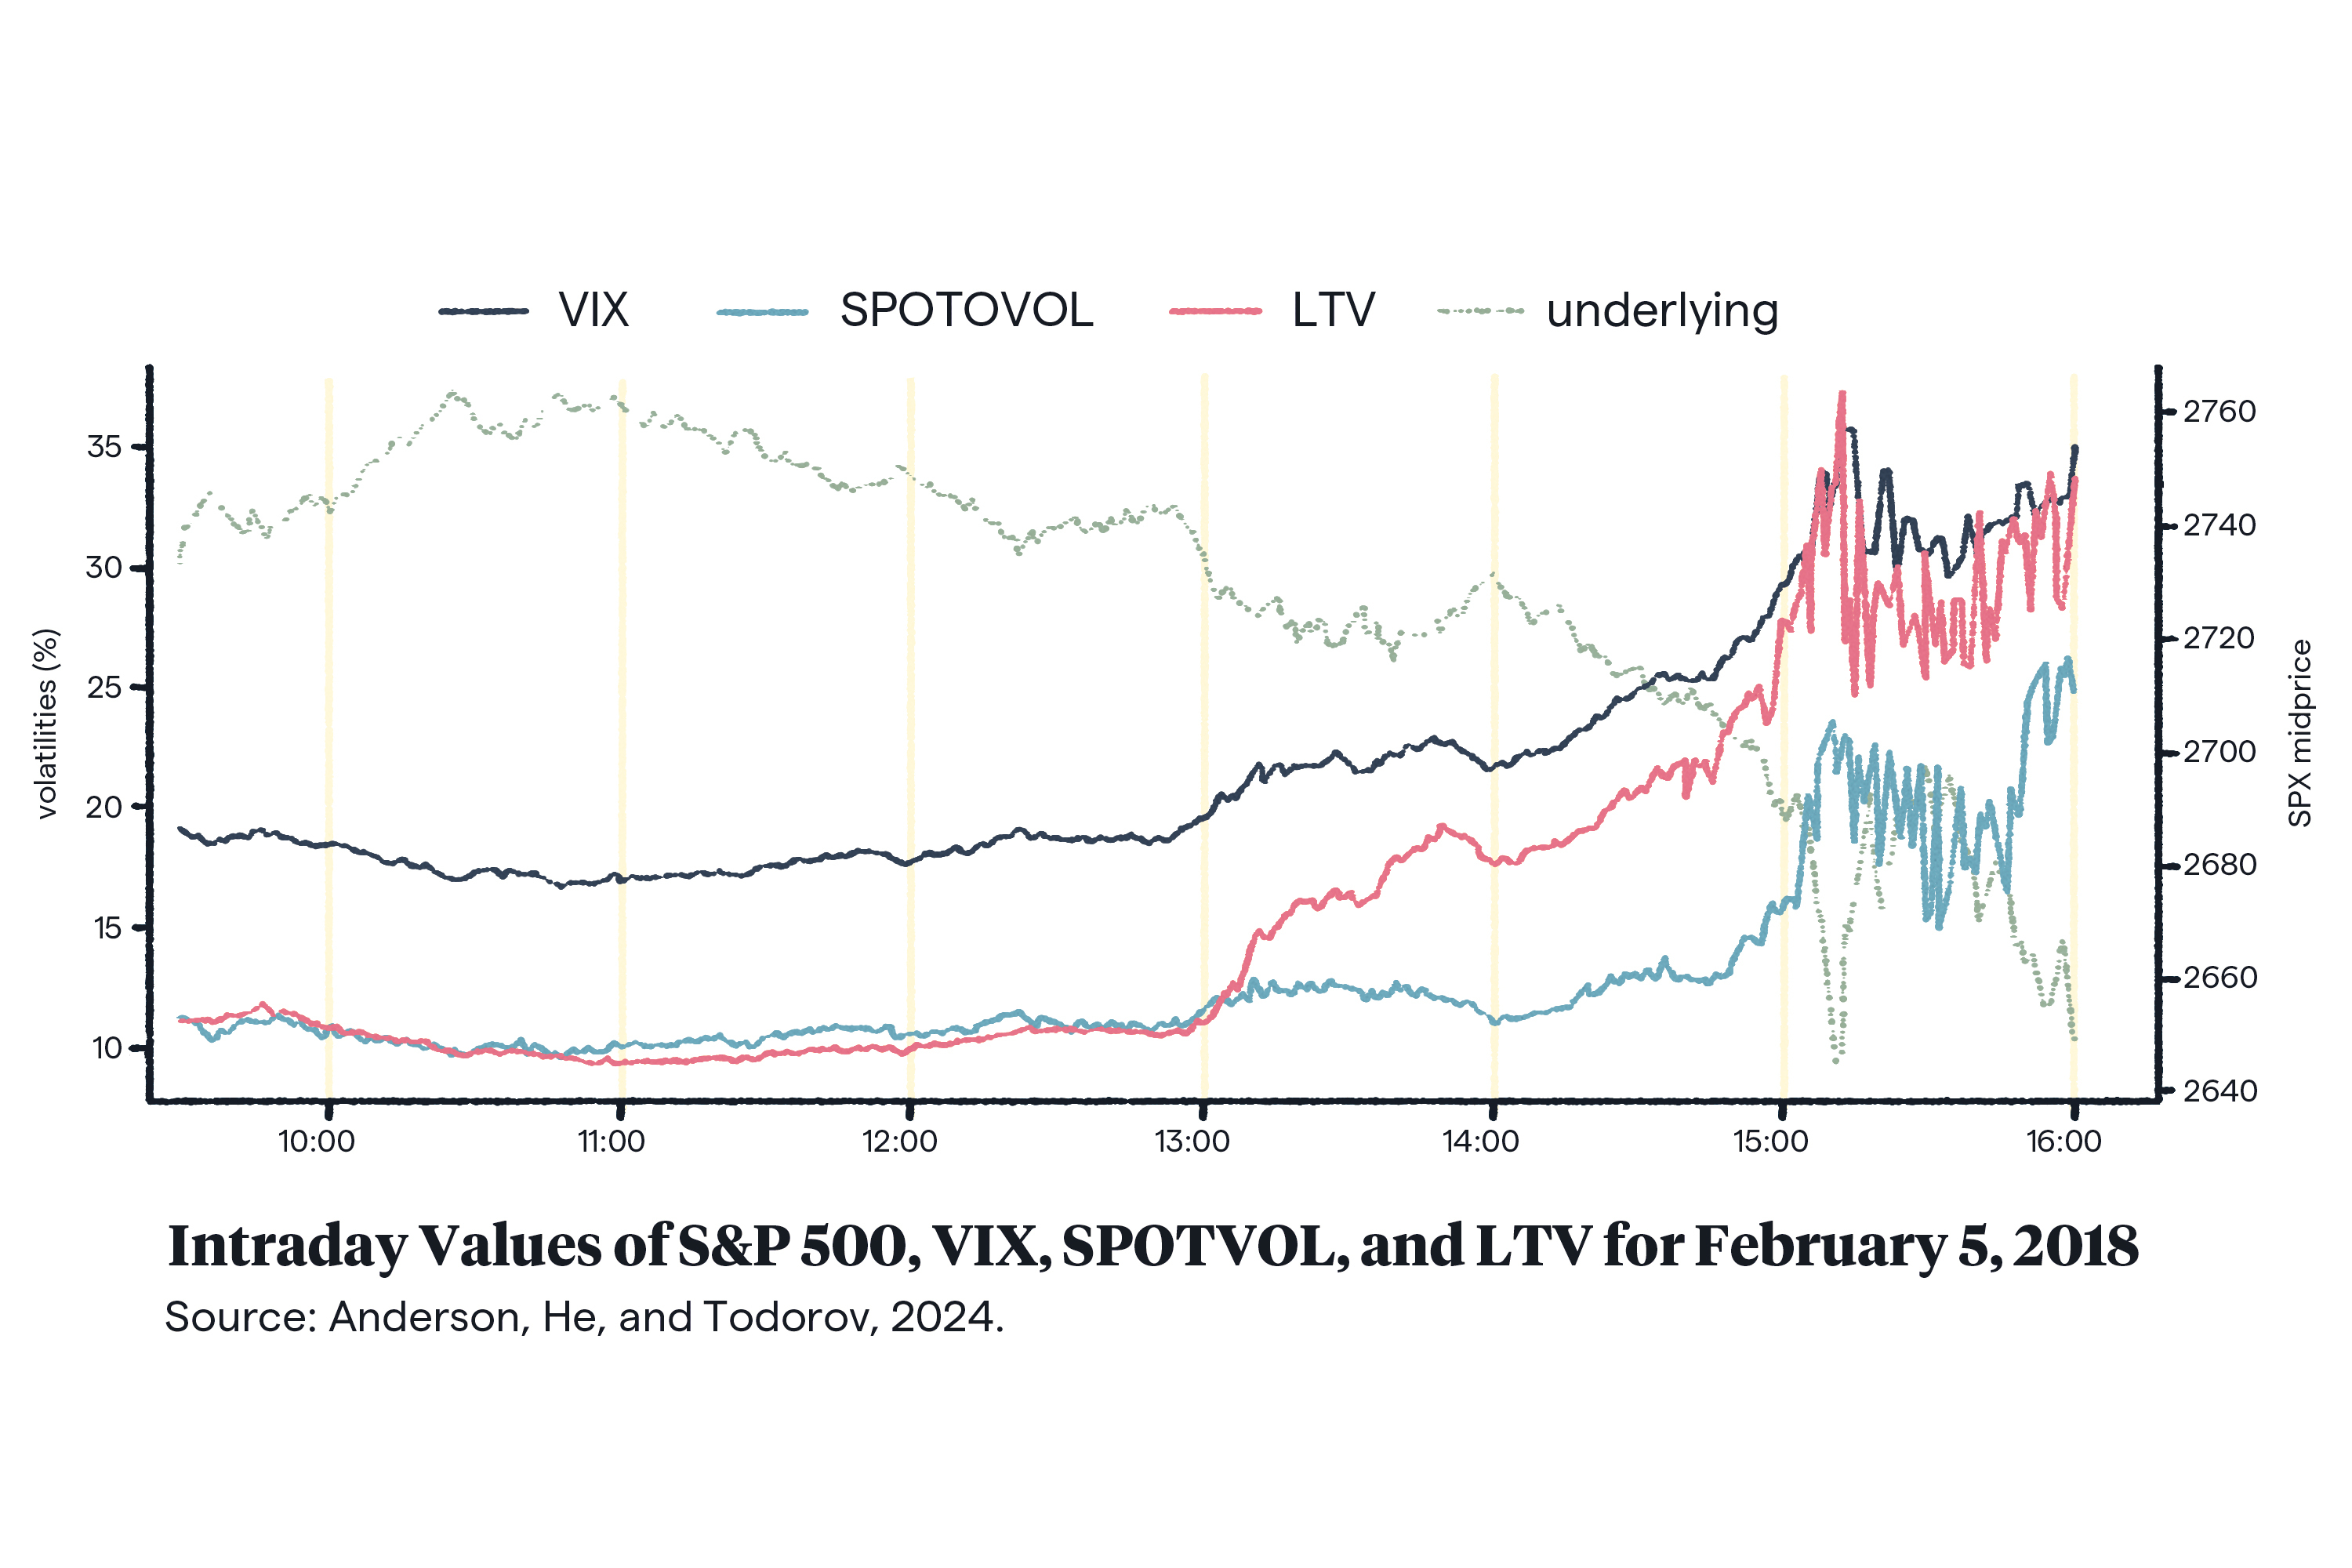
For example, on Feb 5, 2018, the Dow fell nearly 1,600 points before recovering somewhat to end the day 4.6 percent down. The free fall was attributed to sudden investor fear that inflation was rising and the nation’s strong economy might not last.
Indeed, the VIX index jumped 116 percent that day. As CNN reported, “The spike signifies how calm Wall Street had been—and how unprepared the markets were for trouble.”
But as the graph below shows, several hours before VIX began its sharpest increase, LTV had already started to diverge from the SPOTVOL. “In this case,” Andersen and Todorov write, “LTV served as an effective early indicator of the turbulent market conditions that followed, sending a much stronger real-time warning signal than either VIX or SPOTVOL.”
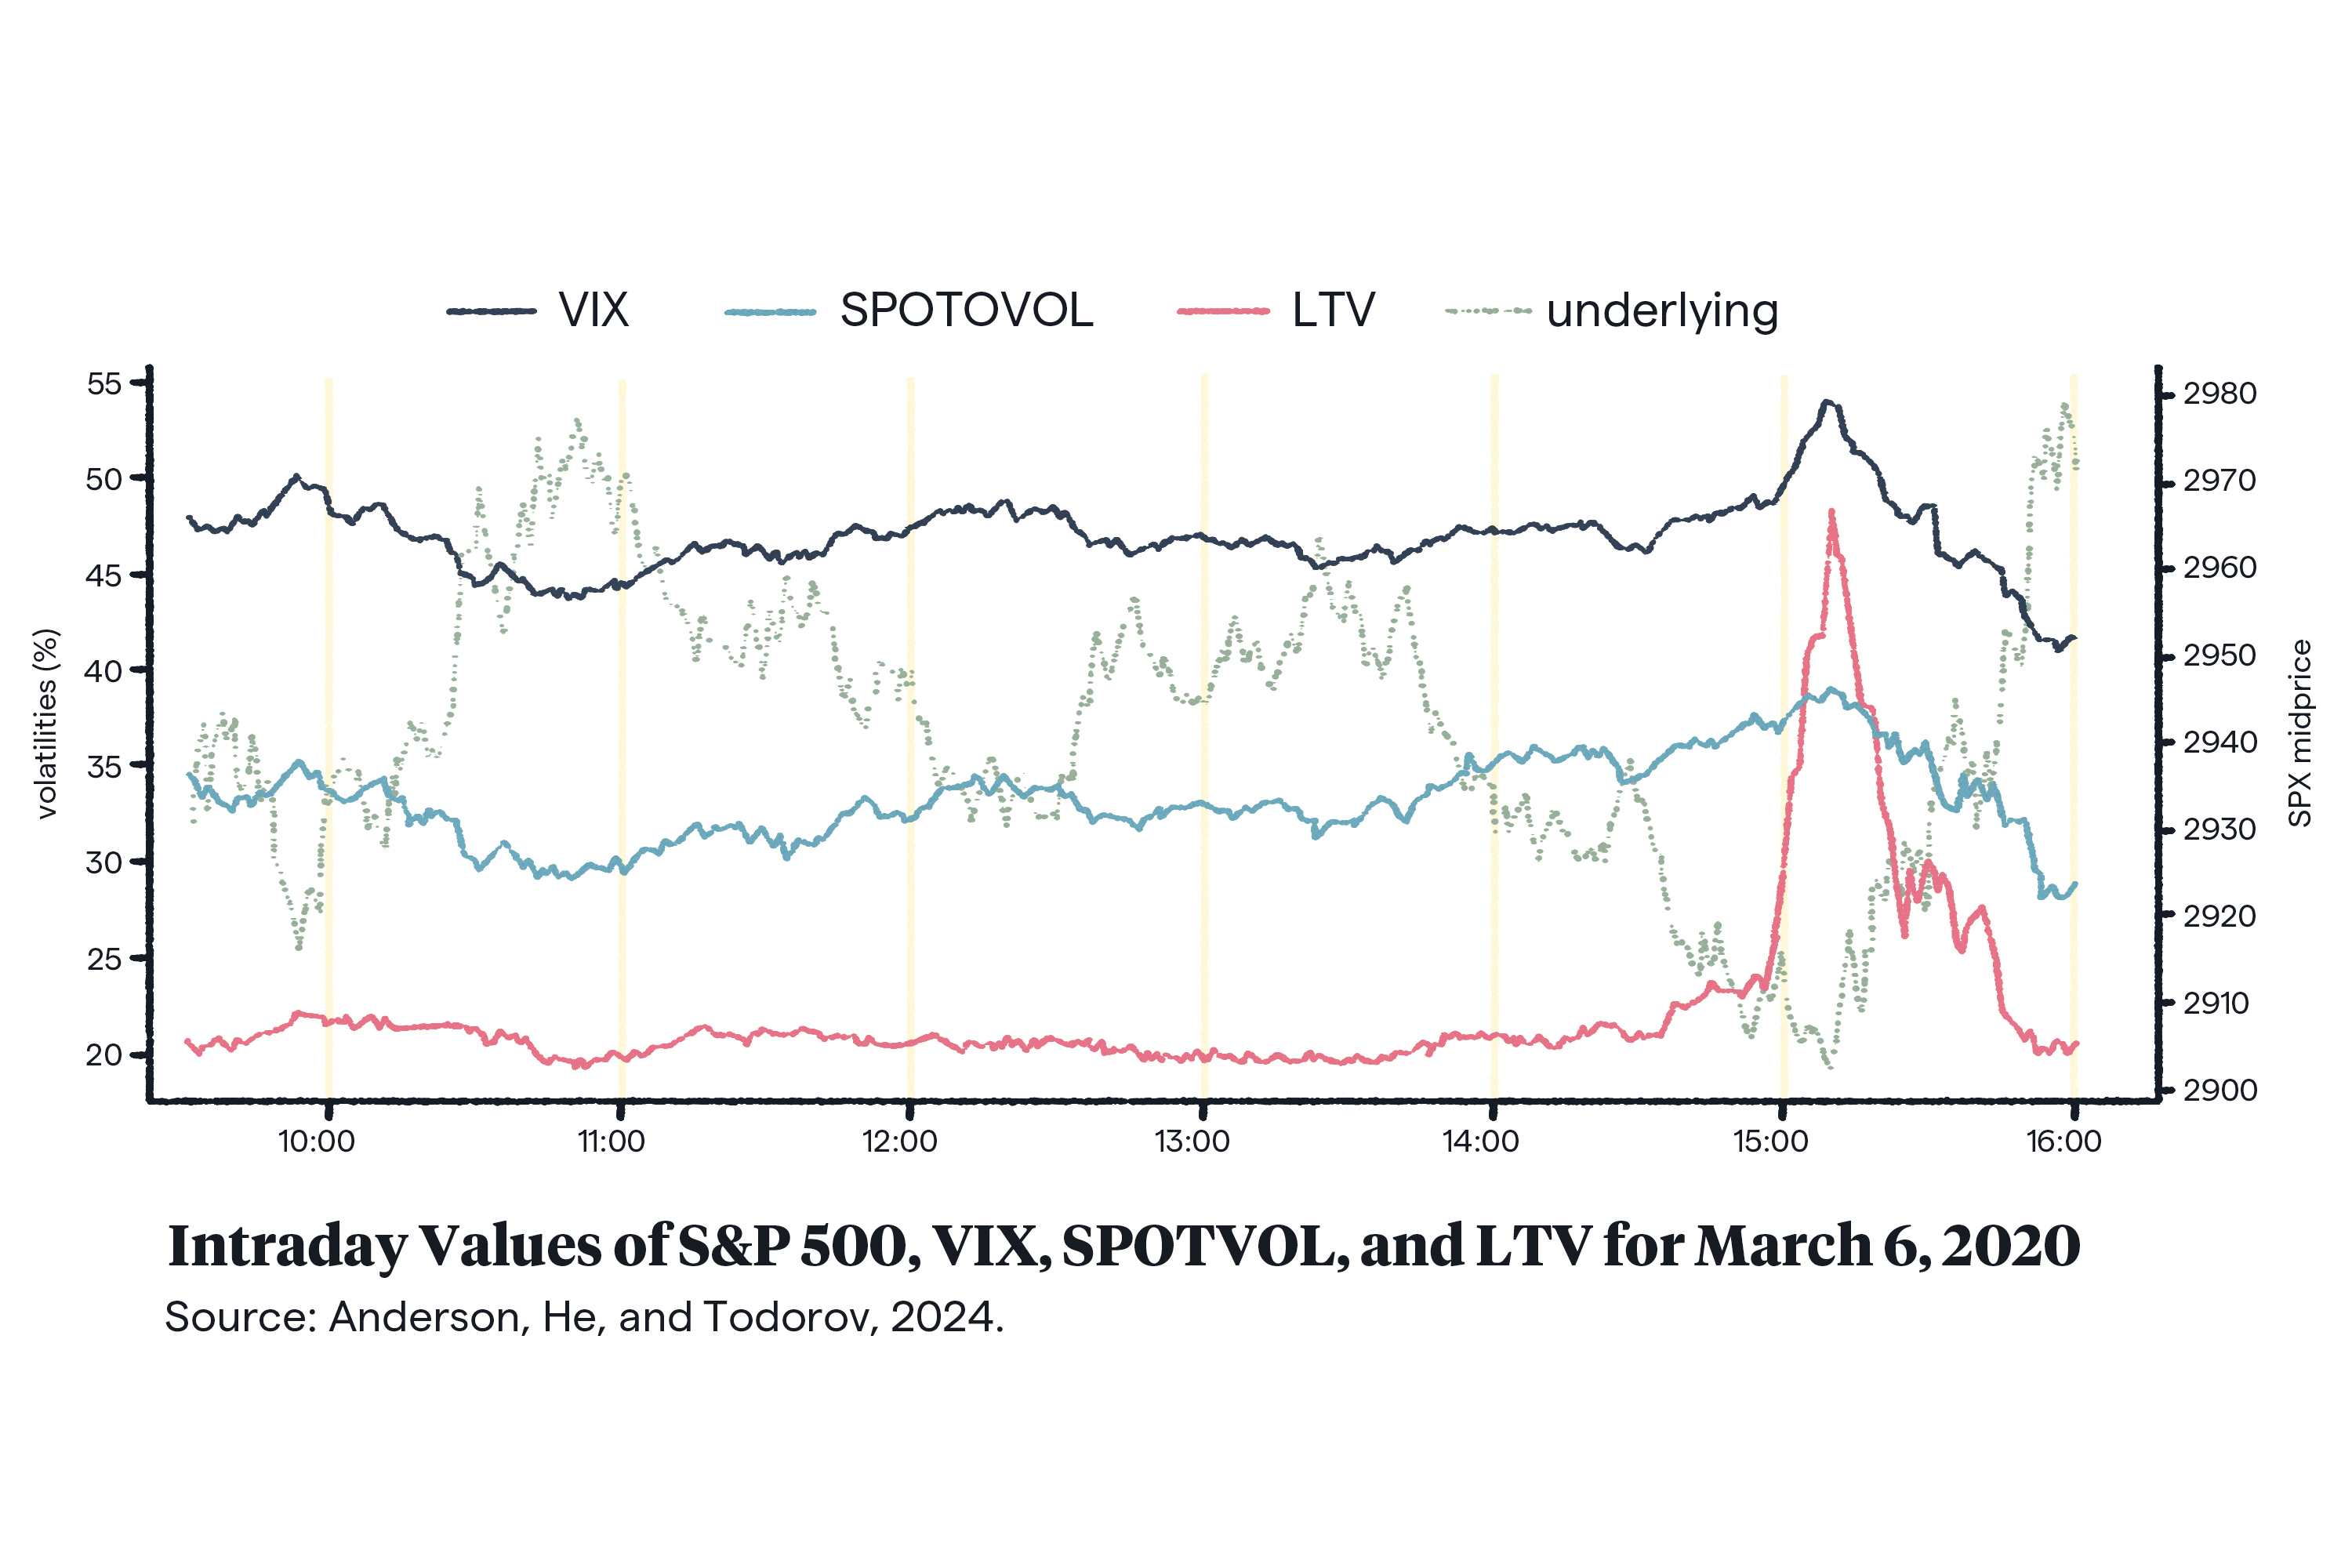
The researchers point to the early days of the pandemic as another example of how using multiple indices together can provide a more sensitive measure of investor sentiment than any single index.
On March 6, 2020, after Russia rejected OPEC’s demand to curb oil production, oil prices plunged by 10 percent. But as shown below, while both VIX and SPOTVOL responded moderately, LTV lurched upward. The researchers suspect that LTV’s dramatic jolt “reflects heightened sensitivity to signs of economic disruption and market risk.”
In the above examples, LTV shifted abruptly before returning to its baseline, reflecting a sudden, brief perception that tail risk had increased. Often, however, “tails tend to be more persistent,” says Andersen, indicating an overall uncomfortableness with the market.
For instance, “after the financial crisis, LTV stayed elevated [in relation to VIX] for a long, long time,” he says. This signaled that deep investor uncertainty (rather than any day-to-day signals) was holding the stock market back. A savvy investor, then, might have predicted the market to do quite well going forward, once investors’ queasiness eventually faded. (As, indeed, the market did.)
At the same time, if VIX is much larger than SPOTVOL, this could suggest that VIX is being heavily influenced by the kind of deep investor uncertainty described above—giving investors who are only interested in immediate volatility an opportunity to capitalize.
“I think of the gap between SPOTVOL and VIX as an indicator of how much the VIX is overpriced in some sense,” says Andersen. “If there’s a big gap, it might be a good time to allow yourself to trade volatility profitably,” he says.
SPOTVOL and LTV are already listed alongside VIX; Andersen and Todorov hope that one day the two new indices become just as popular.
After all, VIX wasn’t always the behemoth it is today. “They started out streaming it, just the same way as our indices are now streaming, and then people started paying attention,” says Andersen.
“I think that you just need a few episodes with extreme market conditions where the two indices diverge and basically tell a different story for people to know that they can hedge different types of risks,” adds Todorov.
*
The figures in this article are excerpted from “Beyond the VIX: Model-Free Spot Volatility and Tail Indices from Short-dated Options,” by Torben G. Andersen, Chun He, and Viktor Todorov. Related research has been supported by a data research grant from the Options Institute, the educational division of Cboe Exchange, Inc. The views expressed in this article and the white paper are those of the authors and do not necessarily reflect the position of Cboe Exchange, Inc., or any of its affiliates. Any errors or omissions are the responsibility of the authors.
Jessica Love is the former editor in chief at Kellogg Insight.
Andersen, Torben G., Chun He and Viktor Todorov. 2024. "Beyond the VIX: Model-Free Spot Volatility and Tail Indices from Short-dated Options." Cboe White Paper.