Featured Faculty
Nathan S. and Mary P. Sharp Professor of Finance
Oleg Bondarenko was previously a Visiting Scholar at Kellogg
Stock markets in the United States on May 6, 2010, were not having a good day. By early afternoon, concerns over the European debt crisis and an upcoming jobs report had driven most major indices solidly into negative territory. But as bad as things looked, they were about to get a lot worse.
At 2:41 PM, prices for E-mini S&P 500 futures—the world’s most liquid equity index contract—started plunging. By 2:44 PM, algorithms used by high-frequency traders to buy and sell that contract were going crazy, selling more than they were buying and threatening to vaporize liquidity. Mere seconds later, those same algorithms bought and sold over 27,000 contracts in just 14 seconds, yet netted only 200 additional contracts. The market was going haywire.
One second after that frenzy, trading in E-mini S&P 500 futures was halted for five seconds, forcing the computers to take a breather. By 3:00 PM, markets recovered from the crash. In just 20 minutes, the Dow Jones Industrial Average had lost and then regained nearly 1,000 points.
The incident had taken a psychological toll. Investors were spooked. And worse, no one seemed to know how it had happened. It would take the Securities and Exchange Commission and Commodity Futures Trading Commission five months to release a report that drew only tentative conclusions. Since then, some preventative measures have been put in place but many experts are not convinced they are enough.
Imagine people’s relief when a new method was announced that could predict imminent flash crashes. Devised by two well-respected economists and the research head of a hedge fund, the measure, called VPIN, or volume-synchronized probability of informed trading, monitors imbalances in trading—when sellers outnumber buyers or vice versa—and purports to peak before problems arise. Its inventors hail it as superior to existing market indicators like VIX, the widely watched volatility index.
The trio behind VPIN—David Easley and Maureen O’Hara, both economists at Cornell University, and Marcos López de Prado, head of high-frequency trading at Tudor Investment—believe the measure has the potential to become a critical financial indicator and have filed for a patent. Furthermore, they are urging regulators to use VPIN as a watchdog signal.
There is every reason to think that might happen—in addition to her position at Cornell, O’Hara also serves on a panel convened by the SEC and the CFTC to investigate the flash crash. She and her co-authors strongly believe that VPIN could alert market regulators to an impending crash like that which occurred on May 6, 2010.
The problem is, not everyone agrees.
Dissecting VPIN
Torben Andersen is one of those people. His research focuses on market volatility and asset pricing, two factors that are central to understanding the flash crash. His interest in peculiar market events is what led him to pick up the VPIN paper.
“It has policy relevance,” says Andersen, a professor of finance at the Kellogg School of Management, of the working paper. What also piqued his interest was the authors’ claim that VPIN could predict market imbalances and short-term volatility better than VIX. “I have other papers where I criticize VIX,” he says, “but I still think it’s fairly good. Maybe you could make it a little bit better, but it’s good.”
“So I started reading it,” Andersen says of the VPIN paper. “It’s just—I can’t get my hands on this thing. It’s such a complicated beast. Not in its construction, but in its mixing of all these different concepts ... And when we started looking at it systematically, in terms of forecasting it performs much worse than VIX.”
In saying “we,” Andersen is referring to himself and his co-author, Oleg Bondarenko, a professor at the University of Illinois at Chicago. Together, the two took VPIN apart to mathematically analyze each component. When they were finished, they concluded that VPIN was not bad, per se, but it could not do what its creators had claimed. “We can’t completely get the results they got,” Andersen says.
To calculate VPIN in its simplest form, you group consecutively traded contracts—say 50,000 in a row—into bins, regardless of time or date. Grouping sequential trades in that way is called trading time, and depending on market volume it can vary substantially with respect to clock and calendar time. In the next step you analyze how many minutes those 50,000 trades spanned, down to one-minute increments, also known as time bars. If trading is happening at a furious pace, it is possible all 50,000 trades in a bin could be squeezed into one minute, or time bar.
After identifying the individual time bars, you assign each bar a “buy” label if there were more contracts bought than sold in that span or a “sell” label if more were sold than bought. Time bars labeled as “buy” are valued +1, while time bars labeled “sell” are valued –1. You then construct a volume-weighted average of the buy-sell indicators for the time bars and take the absolute value of that number. Finally, you merge that bin with the 50 bins preceding it, perform some more mathematical wizardry, and presto—you have calculated VPIN for that minute.
Removing Bias
According to Andersen, the problems with VPIN are numerous. One issue is the way in which it mixes trading volume and time. “How many contracts that are traded in a minute is very highly correlated with volatility. When volatility is high, people trade more, and so these minutes will contain many more contracts. As a result, there will be many less minutes in the volume bucket, and that will bias the measure towards the extreme in a completely mechanical way,” he says.
The conflation of volume and time also caused another problem. Because trades are first grouped sequentially and then next by regular clock time, the separation between two days’ trading sessions is obscured. For example, if there are not enough trades from one day to complete a group, then trades from the next day are used until the proper number, say 50,000, is reached.
As a result, VPIN is highly dependent on when exactly you start counting trades. If you start counting one day later than someone else, your groups will contain different trades and your VPIN will be different. It is also vitally important that you have all the trades for that time period. Any missing trades also will shift the contents of the groups, potentially leading to very different results.
At first, Andersen and Bondarenko could not reproduce Easley, O’Hara, and López de Prado’s findings. “We had to start in ten or fifteen different places in the past in order to replicate their results,” he recounts. Andersen and Bondarenko also realized they were using a different data source than Easley, O’Hara, and López de Prado did. “Upon inspection, it was evident that our trading volume was on average a little bit bigger than theirs,” Andersen says.
The data both groups of researchers used are trades of E-mini S&P 500 contracts on the Chicago Mercantile Exchange—the same instrument that precipitated the flash crash. Easley, O’Hara, and López de Prado obtained their data from the real-time data feed of a hedge fund, while Andersen and Bondarenko received historical data directly from the CME Group. “I’ve subsequently spoken to the guys at the CME Group. This particular contract is only traded electronically, and all the trades are recorded in their system,” Andersen recounts. “That’s the only complete historical record for this data.”
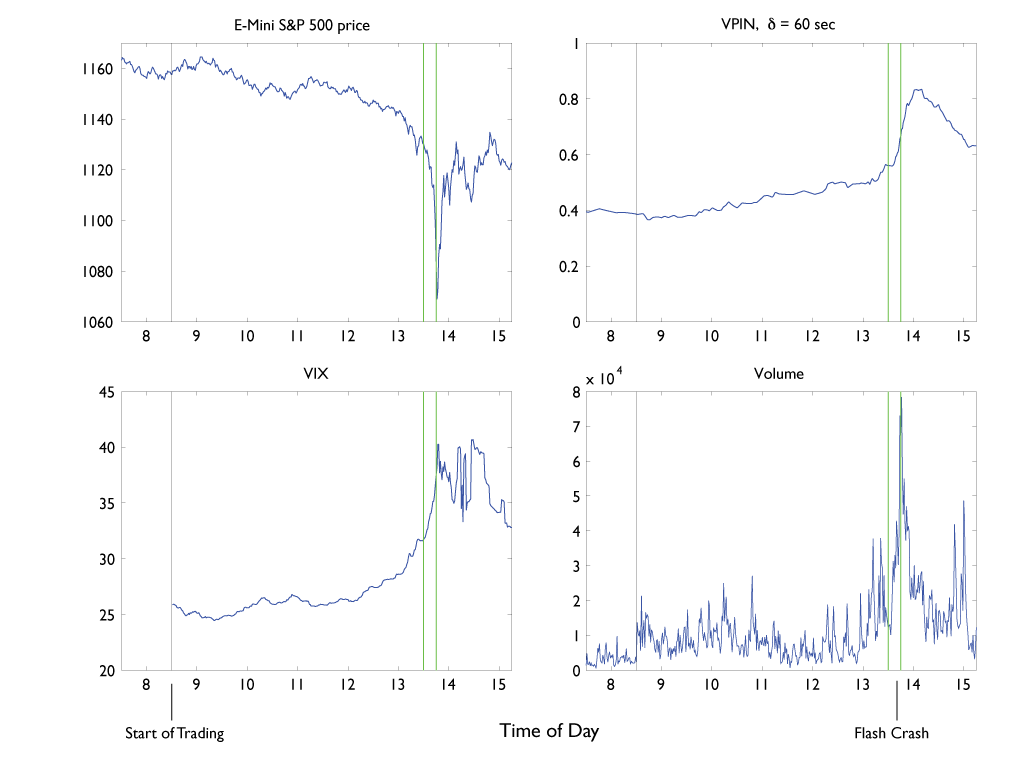
Figure 1. Minute-by-minute data for the E-mini S&P 500 futures index level, the VPIN measure constructed from one-minute data, the S&P 500 volatility index, VIX, and the volume of traded contracts of the E-mini S&P 500 futures on the CME for May 6, 2010. Vertical green lines indicate the timing of the “flash crash.”
When Andersen and Bondarenko were finally able to find the proper starting point, they ran into other problems. The most alarming was that VPIN spiked after the crash, not before, hinting that it may be a reactive metric rather than a predictive one (Figure 1). Also troublesome was that VPIN did not hit an all-time high around the time of the flash crash. In fact, it crossed the same threshold as during the flash crash on at least two other occasions, neither of which corresponded with an errant market.
Revamping VPIN
Despite his reservations, Andersen does not think VPIN is a fatally flawed measure. With some changes, he says, “there is some encouragement that you might be able to say something useful” with VPIN. “If you measured more sensibly, it lines up much more with what actually happened” in the flash crash, he adds.
By taking the absolute value of trading imbalance each minute, VPIN ignores information about the direction in which the market is moving.
The first thing Andersen and Bondarenko suggest is using signed measurements, both within and across the time bars. By taking the absolute value of trading imbalance each minute, VPIN ignores information about the direction in which the market is moving. It may also prevent alternating periods of buying and selling from canceling each other out.
For example, if the selling indicator outpaces the buying indicator over one volume bucket by a margin of 0.5 but reverses by the same amount over the next, both buckets are scored 0.5 by VPIN. The result is an average imbalance of 0.5, despite the overall perfect balance of buying and selling. In contrast, an unsigned VPIN measure would report a change of zero (0.5 – 0.5), providing observers with better information on cumulative imbalances or lack thereof.
Andersen and Bondarenko would also do away with the switch between trading time and calendar time. Starting with trading volume and sticking with trading volume—as opposed to starting with trading volume and then studying trades per minute—a modified VPIN would not be artificially biased toward extreme values during periods of stress.
Preparing for the Next Flash Crash
On September 20, 2010, the SEC and CFTC released a joint report of their investigations. They laid blame for the May 6 flash crash at the feet of a mutual fund, later identified by the Wall Street Journal as Waddell & Reed Financial of Overland Park, Kansas. At around 2:32 PM that day, a trader from Waddell & Reed had started a sell program to unload 75,000 E-mini S&P 500 contracts worth about $4.1 billion, an enormous sale for that instrument. The rate of selling was pegged to 9 percent of trading volume in the previous minute, which meant as volume ramped up the program dumped even more contracts onto the market.
High-frequency trading firms initially picked up the contracts with the intention of quickly turning them around. But the subsequent glut of contracts caused the price to drop further. The high-frequency traders’ algorithms panicked, sparking the 14 seconds of fevered trading in which 27,000 trades were made but only 200 positions were added—what regulators called a “hot potato.” CME computers then stepped in, halting trading for five seconds, enough for everyone to catch their digital breaths. The market started to recover from there, though major indices still ended the day with substantial losses.
It has been nearly two years since the flash crash. The SEC has implemented “circuit breakers” that halt trading when prices start flailing, along with “limit-up, limit-down” controls to prevent individual stock prices from trading outside specified bands. Still, fears linger that despite these defenses another such flash crash could sweep the market.
Easley, O’Hara, and López de Prado are urging regulators to use VPIN as an early warning tool. Andersen, as you might imagine, is less sanguine about VPIN’s utility. For now, though, his hands are tied. “What’s holding us back is that regulators have collected important data about individual firms’ trading activity that American scholars may access, but I can’t as I’m only a resident,” he says. But that does not mean the inquiry is over. “The regulators have this data,” he says, adding, “People are actively working on it.”
“I think there’s hope that you could come up with some useful measures related to VPIN. Exactly how successful they will be, I don’t know.”
Related reading on Kellogg Insight
The VIX, CIV, and MFIV: Measuring up the accuracy of option-based predictors of volatility
Currency Exchange Rates: Micro effects of macro announcements
Andersen, Torben G. and Oleg Bondarenko. Forthcoming. VPIN and the Flash Crash. Journal of Financial Markets, October 2012 (in press).