In the words of Aldous Huxley, “Experience teaches only the teachable.” As United States policymakers attempt to halt the economy’s careening express train to recession, the $168 billion question is: Will the fiscal stimulus plan enacted last month really work? Income tax rebates and business tax breaks trigger déjà vu, with the response to today’s flagging economy bearing striking resemblance to action taken in the dog days of 2001. But this time around, lawmakers are armed with more than just blind faith that putting money in the hands of millions of Americans could make a difference. Landmark research from Jonathan Parker (Kellogg School of Management), David Johnson (Division of Housing and Household Economic Statistics, U.S. Census Bureau), and Nicholas Souleles (Wharton School) reveals that well-designed action plans can significantly impact aggregate consumption demand and jumpstart the economy. This research studying the effects of the 2001 disbursement of rebates on household consumption expenditures offers powerful insights into current troubles, challenging policymakers to build on previous knowledge and optimize fiscal policy.
“Our research has never been more topical then it is now,” Parker said. “The view—significantly based on our work—is that the last rebates worked. People spent roughly two-thirds of their checks in the quarter they received the check and in the subsequent three-month period. To the extent that legislators can get the timing and magnitude right, they could replicate that success.”
But Parker said it will require a bit of skill. “It’s difficult to time fiscal policy correctly,” he said. “And this economic slowdown looks quite different from the last.”
In 2001 the United States entered a recession as a result of a slowdown in consumption spending. In response, lawmakers threw a last minute income tax rebate into the sweeping legislation that they had otherwise created in the form of the Economic Growth and Tax Relief Reconciliation Act. The rebates, typically valued at $300 or $600, were sent to most U.S. households over a ten-week period from late July to the end of September.
Parker, Johnson, and Souleles recognized a great opportunity to shed light on a long-standing debate between policymakers and economic theorists regarding the effectiveness of fiscal policy in ameliorating economic conditions. Policymakers often seek to increase disposable income temporarily during recessions through tax cuts or rebates in the hopes of avoiding or at least mitigating the severity of the slowdown. Theoretically-inclined economists, on the other hand, tend to be skeptical about such strategies because of the canonical theory of consumption known as the permanent-income hypothesis (PIH).
The PIH asserts that in order to maintain a reasonably constant standard of living, households decide on a level of consumption based on an understanding of their long-term resources. Thus, temporary changes in income such as that of a tax rebate should have virtually no bearing on spending patterns. Furthermore, the theory predicts that if a tax rebate were to increase spending, the increase would come as soon as the rebates were announced rather than only once the check arrived.
After the 2001 Tax Relief Act passed, the researchers joined forces with the Bureau of Labor Statistics and the Consumer Expenditure Survey, the nation’s most comprehensive survey of household expenditures, to track the effects of the rebates. A special module of questions was added to the survey to gather concrete data regarding timing of rebate receipt and to gauge its impact on household spending.
One of the unique factors in the research contributing to the power of its results is the randomization of the timing of rebate receipt. Because it was not possible to print and mail more than 90 million rebate checks at once, ten percent were mailed each week for ten weeks based on the second-to-last digit of the tax filer’s social security number, a digit that is effectively randomly assigned. This allowed the authors to identify the effect of the rebate on spending with much less interference from external factors or household characteristics that are difficult to control for.
“We actually had something like a true medical experiment,” Parker said. “Some people were treated in the first week and some people were treated in the last week, and the timing was not connected with high wealth versus low, whether you had dependents or not, whether you were married filing jointly, whether you were of a certain age or geographic location. It provided a clean way to measure the direct causal effect.”
The study demonstrated that the rebates caused an economically significant increase in household expenditure. The average household spent 20-40 percent of its rebate on nondurable goods during the period in which the rebate was received. When comparing spending in the quarter of rebate receipt with the previous quarter, households typically spent 11 percent of the rebate on food and 37 percent on a broad measure of nondurable goods. In dollar terms, this works out to a $52 increase in food expenditures and a $179 increase in spending on nondurable goods on average.
The study also showed that after increasing spending in the quarter of rebate receipt, spending remained high (though not as high) in the quarter following. Expenditures on nondurable goods were up roughly 30 percent of the rebate amount in the subsequent quarter. Accordingly, the cumulative change in expenditures on nondurable goods over both periods is estimated to be around 67 percent of the rebate.
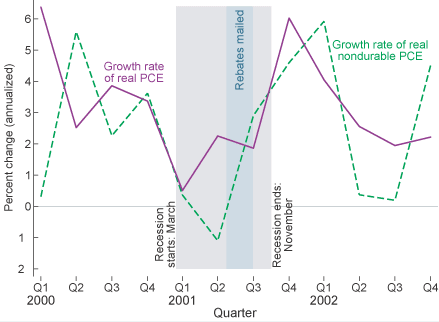
In all, since the rebates totaled $38 billion, the study’s findings imply that the rebates provided a substantial stimulus to the national economy. The findings estimate that the rebates directly raised total personal consumption expenditures (PCE) by about .8 percent in the third quarter and .6 percent in the fourth quarter of 2001, and raised nondurable PCE by 2.9 percent and 2.1 percent in the third and fourth quarters. Figure 1 shows the growth rate of real total and nondurable PCE in the quarters surrounding the rebate disbursement. In the first half of 2001, the economy was in a recession, and both the latter half of 2000 and the first half of 2001 had low PCE growth. After the rebates were mailed out, PCE growth rose substantially and the recession ended in November 2001. These findings contradict the permanent-income hypothesis and strengthen the case for fiscal policy.
Figure 1: Growth rates of personal consumption expenditures
The authors also examined which households were most likely to spend their rebates. Although the estimates were imprecise at times, the researchers found some trends that were economically and statistically significant. They found that households that had low income or few liquid assets consumed a substantially larger fraction of the rebate than households with more typical or high income or liquid assets.
For example, low-income households (those making less than $34,298 a year before taxes in 2001) spent about 76 percent of their rebate on nondurable goods almost immediately, in the quarter in which it arrived. Looking at spending in both the quarter a rebate was received and the subsequent quarter, low-income households increased their spending on nondurable goods by more than the value of the rebate. Middle-income households (those making between $34,298 and $68,999 a year before taxes) increased spending on the same goods by less than 20 percent during the two quarters.
Disparities in spending were even more telling when the authors looked at a household’s liquid assets. Households with low liquid assets (less than $1,000 in their bank accounts) spent more than the value of the rebate cumulatively in the quarter in which the rebate arrived and the subsequent three-month period. Households with average and high liquid assets not only avoided spending increases after receiving the rebates, but they actually decreased their spending and saved money over this period.
So what are the implications for this research in 2008? At $168 billion, the rebates will cost nearly four times more than those in 2001, and they are projected to reach 117 million American households. This time around, tax payers stand to receive quite a bit more than the $300 or $600 rebates of 2001. A couple making less than $150,000 in annual gross income will take home $1,200 in rebates plus an additional $300 per dependent.
Parker is less concerned about the cost, and more concerned about the speed at which people will spend it.
“$168 billion sounds like a lot, but it’s a drop in the bucket when you’re talking about a budget over $3 trillion,” he said. “But I think the propensity for people to spend quickly goes down as the amount goes up. If you get a $300 rebate, you might go buy that thing you’ve been wanting. If you get $3,000, you say, ‘OK. I’m not going to blow this.’ It’s a bigger mistake so to speak, and since people generally want a more stable standard of living, they are going to be less likely to do that.”
Parker anticipates that those with income and liquidity constraints will spend significant amounts of it much like they did the last time around, but he expects the share of the rebates rapidly spent to be less since the spending will probably be more spread out. He says timing is also an issue.
“Last time, I thought it was clear that we were headed for a slowdown. This time there is a lot of talk and not so much in the data,” Parker said. “A bunch of banks lost a bunch of money because they were taking risks, and one sector of the economy—housing—is slowing down. This need not necessarily cause a recession, but it seems to be leading to a lot of pessimism in households.”
In any event, Parker is excited about the prospect of continuing his work on the effects of tax rebates on household spending and the efficacy of fiscal policy.
When asked about his plans for 2008, he states enthusiastically, “We’re trying to do a more elaborate version of what we did last time. We’d like to chase down more data and learn more—to see if people spend the rebates at different rates, if different groups spend it. Any similarities or differences will be very informative about whether and how the efficacy of such programs varies across different episodes.”
Johnson, David S., Jonathan A. Parker, Nicholas S. Souleles (2006), “Household Expenditure and the Income Tax Rebates of 2001,” The American Economic Review, December, 96(5): 1589-1610.


