Featured Faculty
Yevgenia Nayberg
What is responsible for the dramatic ups and downs in the stock market in recent years? Some pundits have pointed the finger at President Trump’s sweeping changes in trade policy. Since taking office in 2017, his administration has withdrawn the U.S. from the Trans-Pacific Partnership, renegotiated NAFTA, and ignited a trade war with China, to name a few key moves.
The idea that trade policy could be driving market fluctuations makes intuitive sense, explains Scott R. Baker, an associate professor of finance at Kellogg. Tariffs and nixed trade deals could make it harder for U.S. companies to make a profit, meaning investors might be tempted to buy or sell their stock in large volumes.
However, there are equally good reasons to think that other factors could be driving the stock market swings—say, the threat of war with North Korea, or iffy GDP growth.
Which factors are truly to blame? In a new study, Baker and collaborators took a fresh approach to that question, using newspaper articles to investigate the economic and policy causes behind stock market volatility.
The researchers developed a new, highly versatile volatility index that allowed them to deduce which factors most contributed to stock market ups and downs over time. They found that trade policy–related market uncertainty is currently “at all-time-high levels,” suggesting that the Trump administration’s actions in that area have indeed become a major driver of volatility, Baker says.
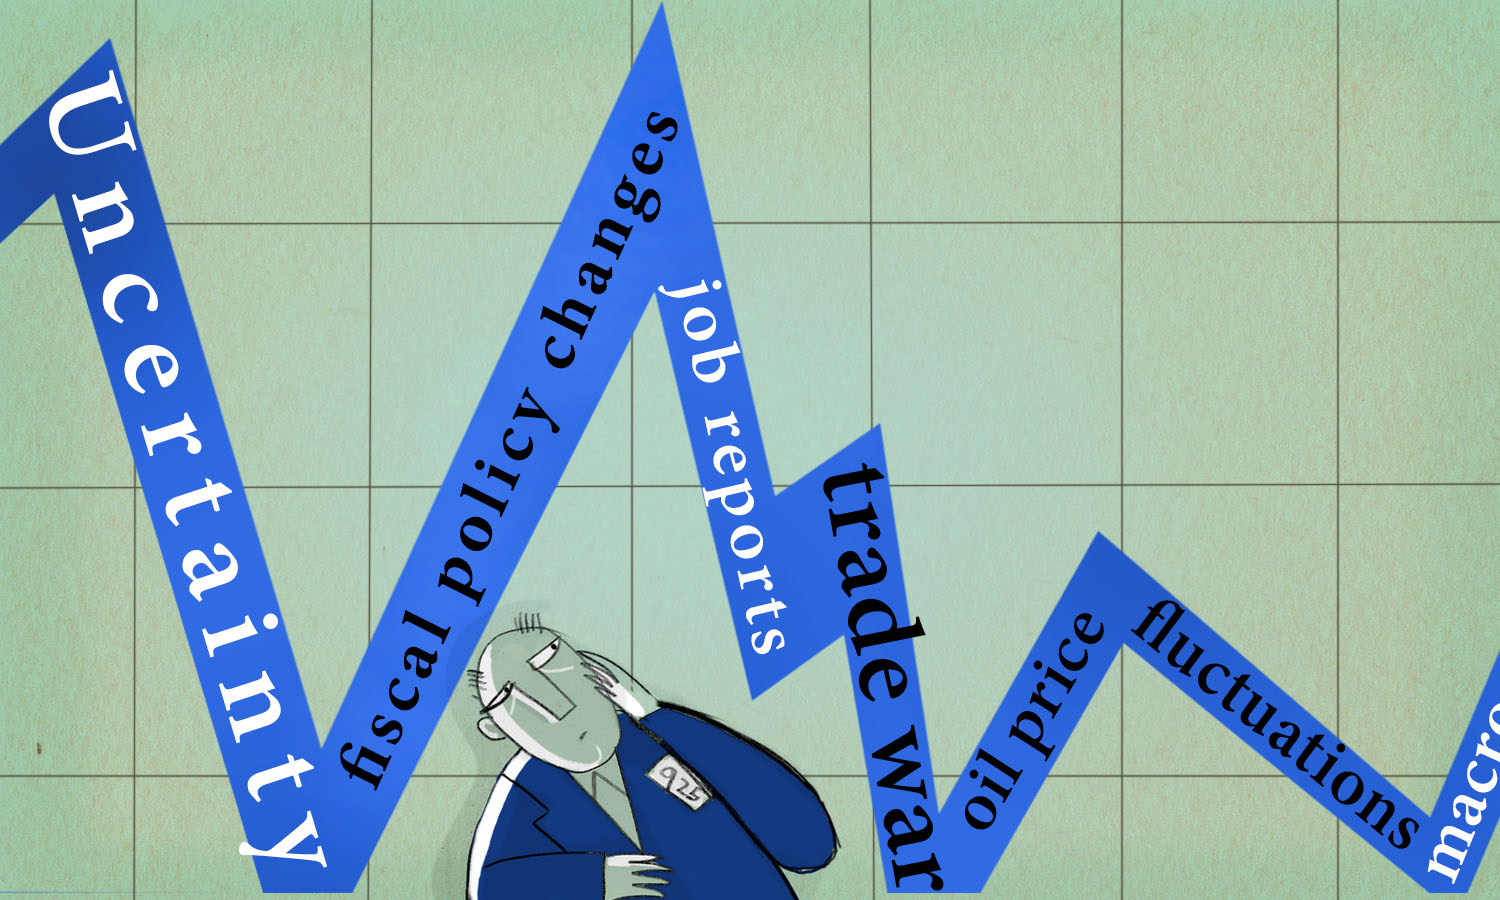
But the study also reveals several other factors that have consistently driven market fluctuations over the last three decades. Among them: macroeconomic outlook (such as new job reports), fluctuations in commodity markets (such as oil prices), and shifts in fiscal and monetary policy (such as a new tax bill, or the Fed changing interest rates).
A New Measure of Market Volatility
The United States already has a well-known measure of market volatility called the CBOE Volatility Index (VIX), which is based on the prices of options, financial instruments that traders use to speculate on whether stocks will increase or decrease in value. However, the VIX gives no indication of which factors might be causing the volatility. “It lacks granularity,” Baker says.
To construct an index that gets at those causes, Baker collaborated with Nicholas Bloom of Stanford University and Steven Davis and Kyle Kost of the University of Chicago. The researchers gathered millions of archival news stories from 11 major U.S. newspapers, including the New York Times, Wall Street Journal, Chicago Tribune, and Washington Post, published between 1985 and 2019. They used software to search for keywords related to volatility (such as “uncertainty,” “risky,” and “variance”) in articles about the economy and the stock market.
“Trump’s trade policy does seem to be a really important driver, even compared to previous trade deals.”
For each month, they counted the percentage of articles that mentioned these terms. This index—which they called the Equity Market Volatility (EMV) tracker—let them easily see how news media perceptions of volatility changed from month to month. (This is the same general technique that Baker, Bloom, and Davis also use to create their economic policy uncertainty index.)
The researchers found the EMV to be a good proxy for actual volatility. As expected, it spiked during moments when the market took wild swings, such as the 1987 stock market crash, the aftermath of 9/11, the 2008 Lehman Brothers bankruptcy, and the 2011 U.S. debt-ceiling crisis. The EMV also matched up fairly well with the VIX.
What Causes Stock Market Swings?
The next step was to pinpoint which specific factors contributed to this volatility. To do so, Baker and colleagues searched for about 30 categories of keywords in the same newspaper articles that mentioned volatility. These categories spanned topics that previous research suggested could likely lead the future of markets to look uncertain, including healthcare, government regulations, labor disputes, taxes, and national security.
Finding a term like “interest rates” or “NAFTA” in the article suggested that the journalist had linked that factor to market volatility.
Making inferences based on media coverage presented some challenges. First, it was possible that the software could pick up red herrings in newspaper articles. For example, Baker explains, “We don’t want to interpret uncertainty over the prospects of the Edmonton Oilers as an increase in uncertainty about oil prices.” The researchers manually reviewed several dozen articles from each category to weed out false positives like this.
Furthermore, just because journalists have linked a certain factor to stock market volatility does not necessarily mean that the factor caused the volatility. “If journalists are wrong or if they’re saying nonsensical things, then it very much could be incorrect,” Baker says.
However, he notes, it is reassuring that the overall EMV tracker mimics the VIX, a metric based entirely on option prices. This suggests that journalists and traders are using similar information to draw the same conclusions about the areas of uncertainty that are driving fluctuations. Presumably, then, when a journalist perceives a new tariff or job report as likely to spur to volatility, it is safe to say traders are making the same connection (and then acting on it by buying or selling, which causes the market volatility).
“As long as this is reflecting the underlying beliefs of the market participants, it’s a useful measure,” Baker says.
Economic Uncertainty and Public Policy
A few major categories stood out as being frequently linked to stock market volatility. Nearly three-quarters of EMV-identified articles mentioned macroeconomic news, such as the GDP or job reports. Commodity markets, such as the prices of oil, gold, steel, or wheat, were found in 44 percent of the stories, and interest rates in 31 percent. Fiscal policy, monetary policy, and regulation were each mentioned in about 25–35 percent of articles.
While these subjects have been affecting market volatility more or less consistently since the 1980s, other topics seem to have started contributing only recently.
For instance, trade policy rarely influenced uncertainty during the George W. Bush and Barack Obama presidencies—yet the trade policy tracker showed large spikes whenever President Trump announced a major policy change. In fact, the last time that the tracker showed comparable levels of trade-related stock market uncertainty was during discussions of NAFTA in the 1990s, the biggest free trade deal that U.S. had ever considered.
“Trump’s trade policy does seem to be a really important driver, even compared to previous trade deals,” Baker says.
“Increases in the scope of regulation have led more and more facets of the economy to be indirectly controlled by the government.”
More generally, the analysis revealed the growing ability of policymakers to influence the stock market. Today, policy issues of all sorts—from debt-ceiling crises to military interventions in the Middle East—are much more commonly associated with market fluctuations than they were in the 1980s. To Baker, that comes as no surprise.
“Over the past century, the fraction of GDP driven by government spending has increased markedly,” he explains. “Moreover, increases in the scope of regulation have led more and more facets of the economy to be indirectly controlled by the government.” As a result, virtually every sector of the economy, from heavy industry, to tech, to energy, to healthcare, can now be affected by an unexpected decision by the federal government—something that is clearly reflected in the results.
“Something Nice about the Simplicity”
The EMV offers several features that the VIX is missing, Baker says. For one, many countries don’t have the options market necessary for a VIX-like measure of equity market uncertainty.
Furthermore, the VIX began in the 1980s, so economists can’t use it to study longer-term historical patterns. But because many newspaper archives extend back to the 1800s, the EMV allows you to look further back in time. Baker and his coauthors are currently extending their analysis deeper into the past, to see how the drivers of market volatility have changed over the decades. They also are examining whether particular industries are more sensitive to uncertainty than others.
Baker envisions that economists and policymakers could use the data in mathematical models of how policy affects markets to better predict the effects of future policy changes.
He also highlights several strengths of his method, noting that it matches the VIX over longer time periods than some other volatility metrics have. And while looking for words in newspaper articles might seem rudimentary compared to sophisticated AI algorithms available today, Baker believes that the simplicity of this technique could be an advantage for other researchers looking to parse media coverage.
“People are more comfortable using [this method],” he says. “There is something nice about the simplicity of this approach relative to the black box of many machine-learning algorithms.”
About the Writer
Roberta Kwok is a freelance science writer based near Seattle.
About the Research
Baker, Scott R., Nicholas Bloom, Steven J. Davis, and Kyle J. Kost. “Policy News and Stock Market Volatility.” Working paper.
Insight in your inbox
Receive our newsletters to keep up with the latest research and ideas from faculty at the Kellogg School of Management.
This website uses cookies and similar technologies to analyze and optimize site usage. By continuing to use our websites, you consent to this. For more information, please read our Privacy Statement.