Featured Faculty
Professor of Psychology, Weinberg College of Arts & Sciences; Professor of Design, McCormick School of Engineering (Courtesy); Director, Northwestern Cognitive Science Program; Professor of Management and Organizations (Courtesy)
Yevgenia Nayberg
Since the days of William Playfair and Florence Nightingale, people who design charts and graphs have debated how to best present information visually. And while some claim that functionality should always be prioritized over aesthetics, or that pie charts are never the right choice, most people can agree that factual accuracy and intellectual honesty are hallmarks of good design.
According to Steve Franconeri, a professor of psychology in the Weinberg College of Arts & Sciences who is a professor of marketing at the Kellogg School by courtesy, designing honest visuals has less to do with stringent rules and more to do with respecting the ethos of fair argumentation.
“There’s as much complexity in deciding what an honest visualization is as there is in deciding what an honest argument is,” Franconeri says. “But the goal is to make your visual match the argument you’re making. If your viewer doesn’t see your honest argument in the visualization, then, whatever your intentions, it’s badly designed.”
Franconeri offers guidelines for designers to keep in mind when visualizing data.
Every decision in the creation of a data visualization needs to be considered carefully. But there’s one common choice that serves as a case study for the complexities of honest visualization: whether to truncate the y-axis of a graph by starting at an arbitrary number.
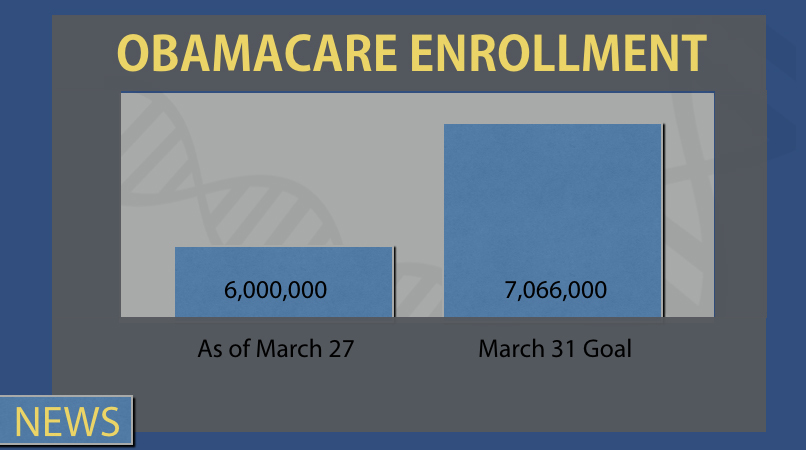
In theory, a truncated axis is not an inherently dishonest way to depict data. For example, this simple line graph (fig. 1) compares the total enrollment in Obamacare on two different dates. Nothing dishonest there. But the truncated axis plays a trick on the eyes, making the difference between the two numbers seem far larger than it is.
In a recent paper, Franconeri and his coauthors showed that, even when viewers are warned about this illusion, they were powerfully affected by it, judging changes as being far larger even though the underlying numbers had not changed. Highlighting and carefully explaining a truncated y-axis—and even asking viewers to write down the graphed values—did surprisingly little to dispel the illusion.
“The problem is that even when you know the right numbers, the verbal part of the brain is easily overwhelmed by the visual image,” Franconeri says. “So visual memory beats verbal memory, hands down.”
Because of this illusion, there’s a tendency to view axis truncation as inherently deceptive. But a truncated y-axis isn’t always a cardinal sin. Take a moment to check the performance of the S&P 500 across the year 2020 on any stock website. The axes are likely set by default to range from around 2000 to 4000, stretching the chart line to be twice as tall to make recent changes easier to discern than if the chart range was 0 to 4000. But that increased precision comes at a cost: every rise and fall seems twice as big to your eye. That design seems honest in this context, because as an expert, you have the background knowledge needed to ignore this illusion. But would it be honest for someone new to the stock market?
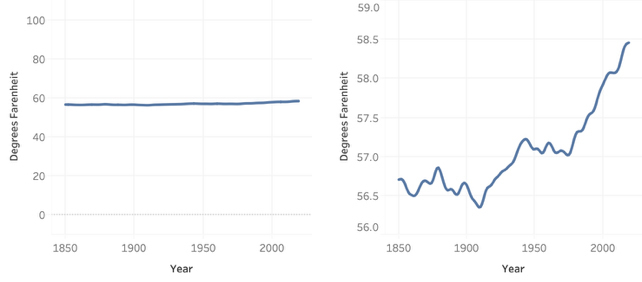
For some problems, it might be misleading not to truncate the y-axis. In a controversial climate-change chart tweeted out by the National Review (fig. 2, adapted here), the trend of a warming climate was obscured by starting the y-axis at 0 degrees Fahrenheit. Here, the zero baseline hides the important pattern so strongly that it may be considered dishonest.
“That visual doesn’t match the honest argument, since a relatively tiny change in temperature can mean a foot of water on someone’s property in Florida,” Franconeri says. Most designers would consider the version at right, which is more similar to the choice for a stock chart, as the honest depiction of the data.
Ultimately, Franconeri says, designers need to ask, “What is your honest argument, and who is your audience? Your design should lead that viewer to see that argument.”
Just as a film might open with an establishing shot to orient the audience to its setting, a clear data visualization should offer viewers a glimpse of the global picture before it focuses on a certain trend or number.
“Whatever information you’re starting with,” Franconeri says, “give the full range, and then zoom in on the local.”
Take this chart of deaths in the U.S., which contains a beneficial distortion by starting its y-axis at 50k, similar to the S&P 500 example. This allows the viewer to better see an increase in deaths in 2020 that are likely due to COVID-19.
“That format lets you see the increase far more clearly,” Franconeri says. “But there’s a tension here—you also might mistake the increase as being far larger than it actually is. Even the slopes of the spikes are steeper because of this distortion, so the increase may look even more dramatic.”
In their research, Franconeri and his colleagues concluded that there is no clear distinction between “deceptive” and “truthful” visualizations in this respect—that designers themselves must accept responsibility for depicting clearly and accurately the effects they are trying to communicate.
“The author of the annualized U.S. deaths chart thought carefully about how to balance clarity and honesty, giving careful annotation and providing additional graphs with a zero baseline to show context honestly,” Franconeri says.
Data visuals have the ability to communicate more efficiently than verbal reports or spreadsheets. But designers need to keep in mind that there are many possible patterns that viewers might see in a visualization.
“Think of the illusion where you see a single animal as either a duck or rabbit, or the figure as a young or old woman,” Franconeri says. “You can see different percepts in the same image. Graphs work in the same way.”
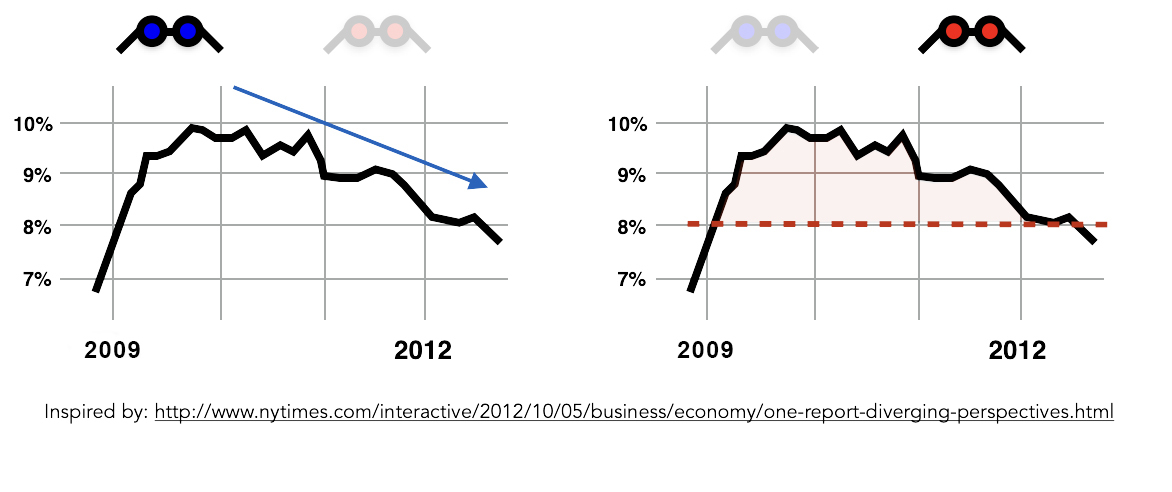
These two charts (fig. 3) adapted from a New York Times story provide an example of how different people can see different patterns in the same set of U.S. employment data under President Obama. Democratic (blue) viewers might focus on 24 consecutive months of job growth, while the Republican (red) perspective might focus on the overall rate shaded in red under the curve, rather than Obama’s stated target of eight percent. These visual perspectives align with what each viewer might consider the honest argument from the data, while being used to promote a different take on whether those data signal success or failure.
Regardless of what lenses you or your readers are wearing, the goal of any visualization is to reveal the data pattern that you see to anyone who may encounter it. There are many ways to do this. The New York Times example above adds color and annotation. But you may feel that telegraphing your intention is unnecessary, because the “right” pattern pops out so easily for you.
“That’s a common misprediction,” says Franconeri, “because once your brain settles on a pattern, you assume that other people will see that same pattern, and they don’t. Just because you see a duck doesn’t mean that others won’t see a rabbit.”
This misplaced assumption is called the “the curse of knowledge,” because it is difficult to turn off your own knowledge, to see the world through another person’s lenses. Those who are most familiar with the data are sometimes the least helpful in determining whether a message is clear.
Along with considering design additions such as color and annotation, it helps to gather feedback from others before putting your graphic into the world. A quick series of experiments can go a long way toward refining a design and testing whether it reads as intended. The experiments do not have to be elaborate or formal—often, just showing two or three potential designs to a few people and asking them to answer questions about the information in them is sufficient.
“You know what your honest argument is,” Franconeri says. “But your curse of expertise means you overlook your own potentially deceptive designs—like using a nonzero y-axis. If you show someone your work and ask them to report back what patterns they see, and what they conclude from the data, and their response matches your honest argument, then you’ve made a great visualization.”